Figure 7
Rising spending on Social Security led to falling rates of poverty for the elderly: Social Security expenditures as a share of GDP and poverty rate for 65+, 1959–2019
| Elderly poverty | Elderly poverty-imputed | SS/GDP | |
|---|---|---|---|
| 1959 | 35.20% | 1.96% | |
| 1960 | 34.24% | 2.05% | |
| 1961 | 33.29% | 2.24% | |
| 1962 | 32.33% | 2.37% | |
| 1963 | 31.37% | 2.38% | |
| 1964 | 30.41% | 2.34% | |
| 1965 | 29.46% | 2.44% | |
| 1966 | 28.50% | 28.50% | 2.43% |
| 1967 | 29.50% | 2.45% | |
| 1968 | 25.00% | 2.62% | |
| 1969 | 25.30% | 2.59% | |
| 1970 | 24.60% | 2.93% | |
| 1971 | 21.60% | 3.14% | |
| 1972 | 18.60% | 3.20% | |
| 1973 | 16.30% | 3.56% | |
| 1974 | 14.60% | 3.73% | |
| 1975 | 15.30% | 3.91% | |
| 1976 | 15.00% | 3.98% | |
| 1977 | 14.10% | 4.00% | |
| 1978 | 14.00% | 3.89% | |
| 1979 | 15.20% | 3.91% | |
| 1980 | 15.70% | 4.15% | |
| 1981 | 15.30% | 4.32% | |
| 1982 | 14.60% | 4.60% | |
| 1983 | 13.80% | 4.52% | |
| 1984 | 12.40% | 4.28% | |
| 1985 | 12.60% | 4.22% | |
| 1986 | 12.40% | 4.23% | |
| 1987 | 12.50% | 4.14% | |
| 1988 | 12.00% | 4.08% | |
| 1989 | 11.40% | 4.03% | |
| 1990 | 12.20% | 4.09% | |
| 1991 | 12.40% | 4.29% | |
| 1992 | 12.90% | 4.32% | |
| 1993 | 12.20% | 4.34% | |
| 1994 | 11.70% | 4.28% | |
| 1995 | 10.50% | 4.29% | |
| 1996 | 10.80% | 4.24% | |
| 1997 | 10.50% | 4.16% | |
| 1998 | 10.50% | 4.07% | |
| 1999 | 9.70% | 3.94% | |
| 2000 | 9.90% | 3.92% | |
| 2001 | 10.10% | 4.02% | |
| 2002 | 10.40% | 4.09% | |
| 2003 | 10.20% | 4.05% | |
| 2004 | 9.80% | 3.98% | |
| 2005 | 10.10% | 3.93% | |
| 2006 | 9.40% | 3.94% | |
| 2007 | 9.70% | 3.98% | |
| 2008 | 9.70% | 4.12% | |
| 2009 | 8.90% | 4.60% | |
| 2010 | 8.90% | 4.60% | |
| 2011 | 8.70% | 4.59% | |
| 2012 | 9.10% | 4.71% | |
| 2013 | 9.50% | 4.76% | |
| 2014 | 10.00% | 4.76% | |
| 2015 | 8.80% | 4.78% | |
| 2016 | 9.30% | 4.78% | |
| 2017 | 9.20% | 4.74% | |
| 2018 | 9.70% | 4.72% | |
| 2019 | 8.90% | 4.81% |
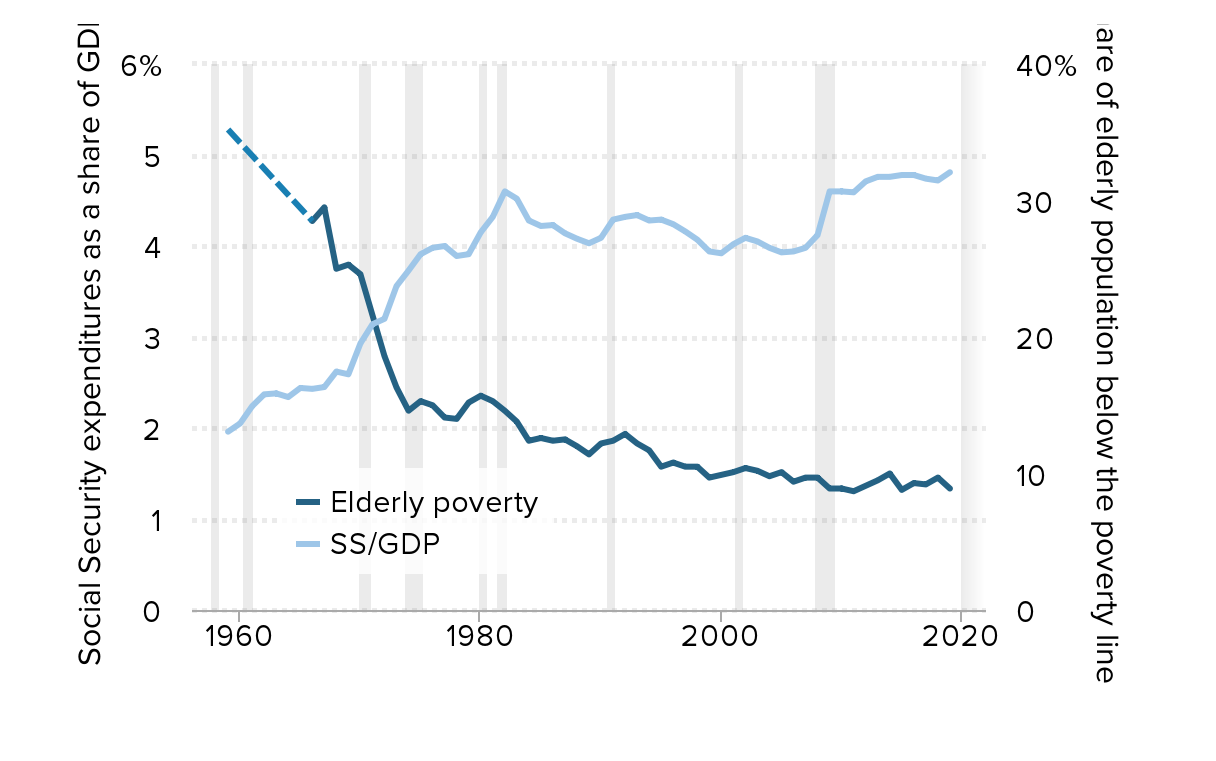
Note: Shaded areas denote recessions. No formal data exists in the years between 1959 and 1966 for the percentage of elderly persons living in poverty. The dotted line denotes a linear extrapolation between the earliest data point (1959) and the beginning of the complete series (1966).
Source: Authors' analysis of Current Population Survey, Annual Social and Economic Supplement Historical Poverty Tables [Table 2 and 3] and U.S. Treasury [Table 4a].
This chart appears in:
Previous chart: « Growth in the number of full-service restaurant establishments and employment by type of tipped wage, 2011–2019